Topps Card Back History
Emily Wilson’s celebrated 2017 translation of Homer’s Odyssey, the first in English by a woman, included a dazzling new spin on a very old line: “Tell the old story for our modern times.” It’s a memorable paraphrase, but not everyone has loved it. Some have insisted that the language Wilson used strayed too far from the original. Nevertheless, the question of how to tell the old story for a new generation is well worth considering.
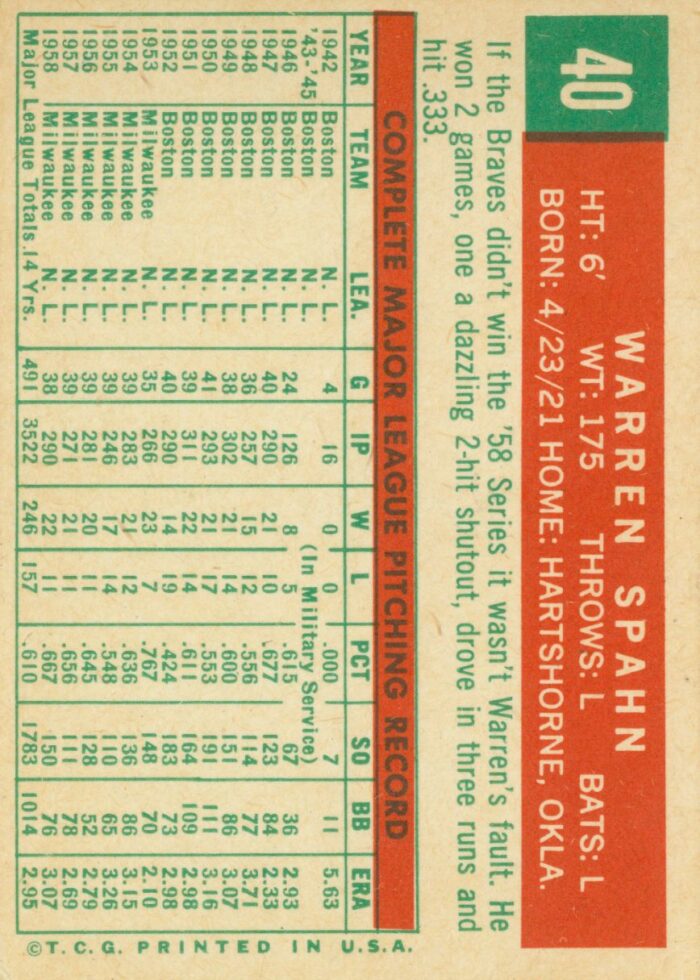
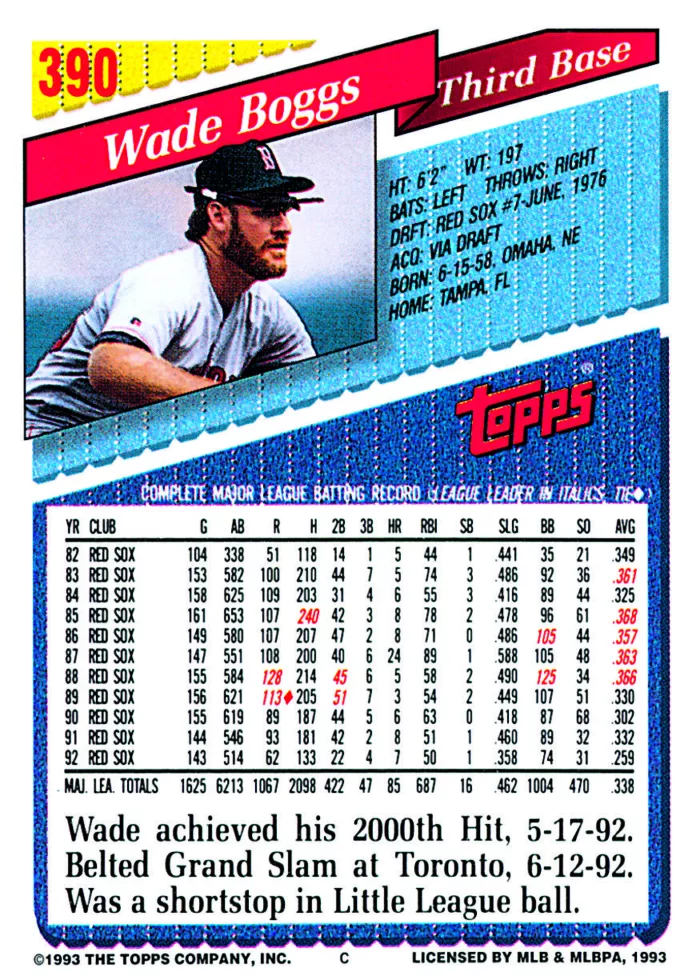
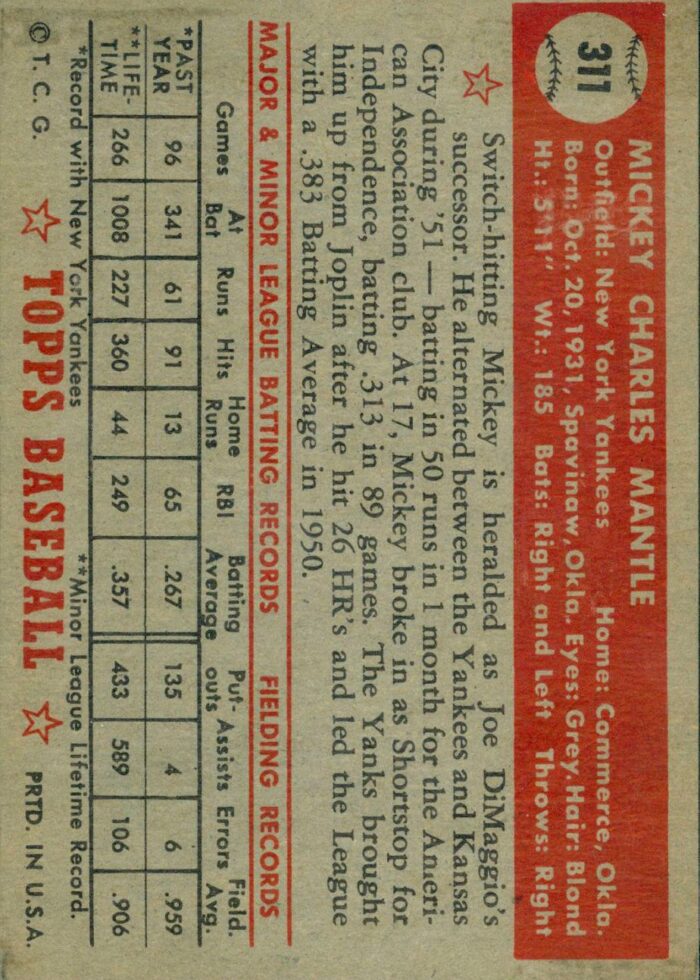
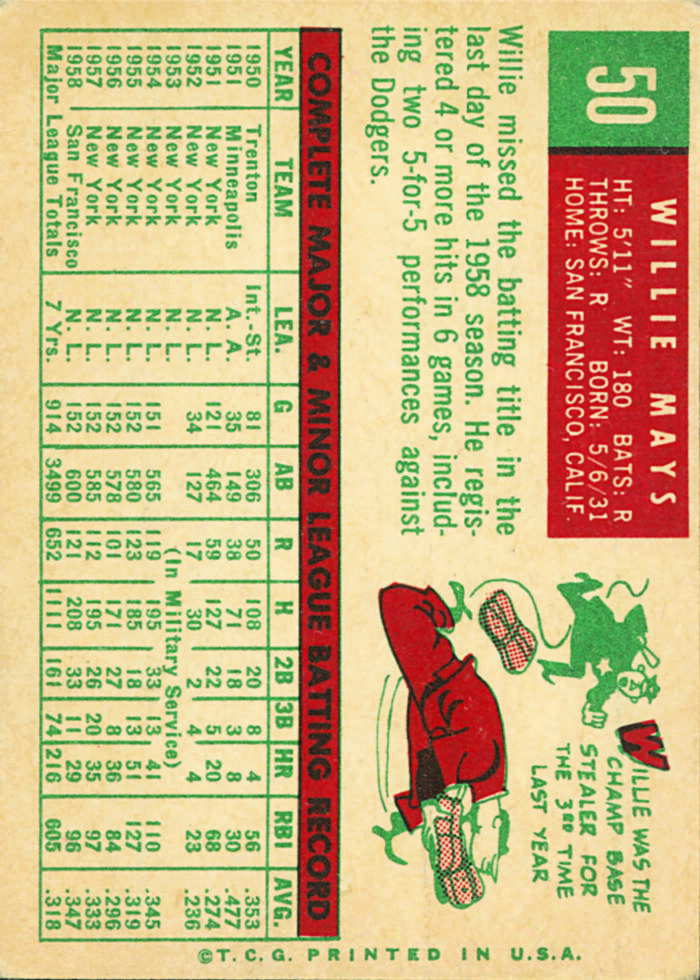
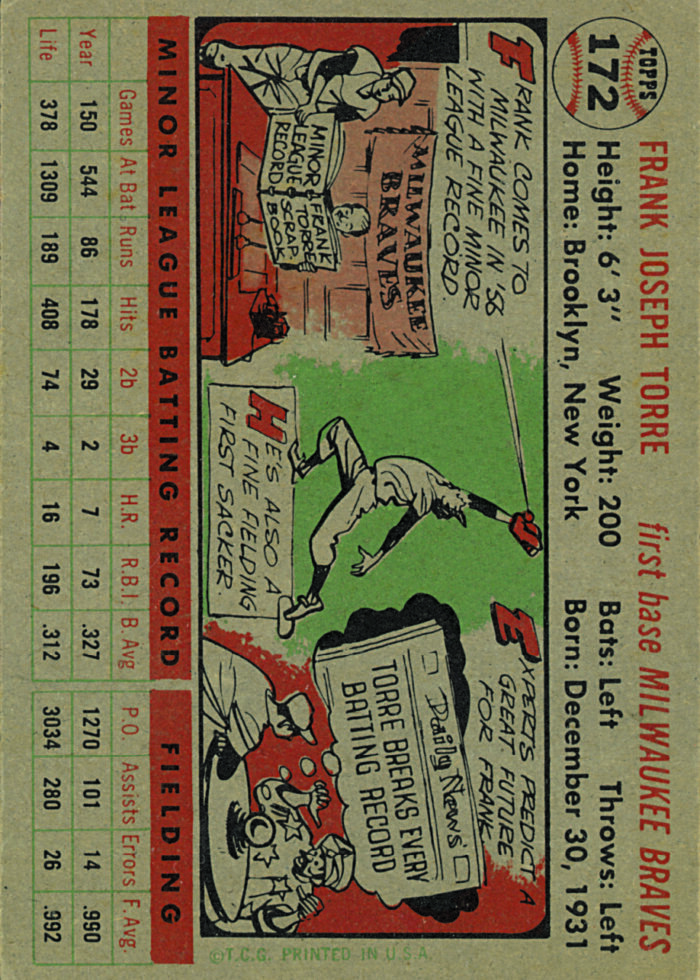
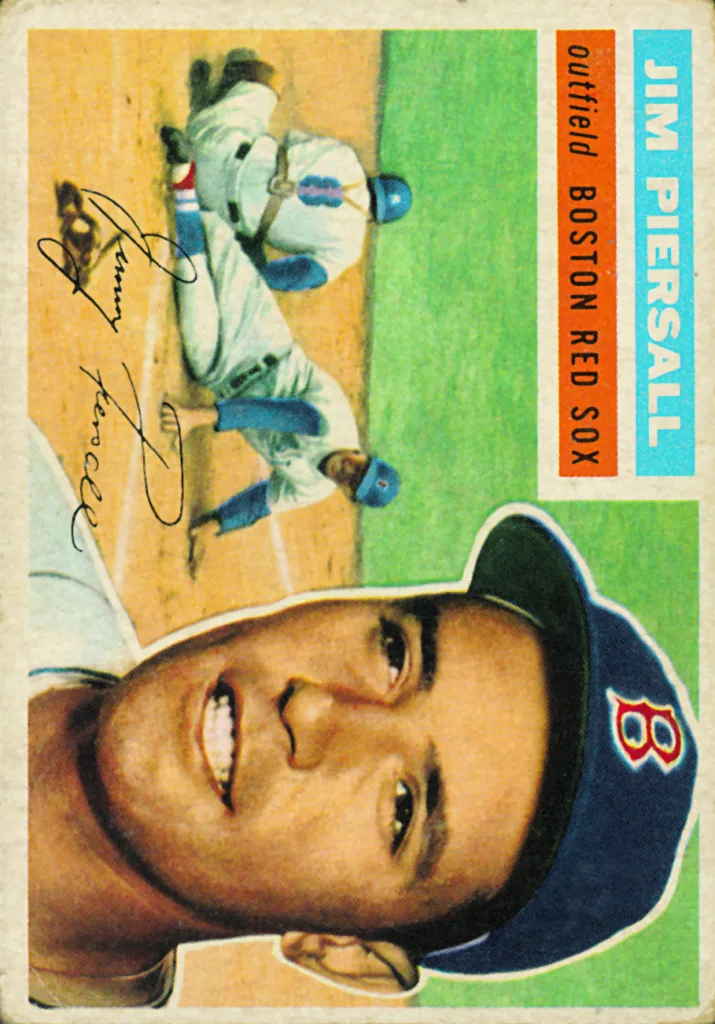
In The Hobby, design innovation has been a key factor, from the introduction of quality photography in the golden age of the mid-20th century to modern refractor technologies and variations on layout, gloss, lettering, etc. In fact, between 1952 and 2004, almost every aspect of card design changed—with one notable exception: the statistics included on card backs.
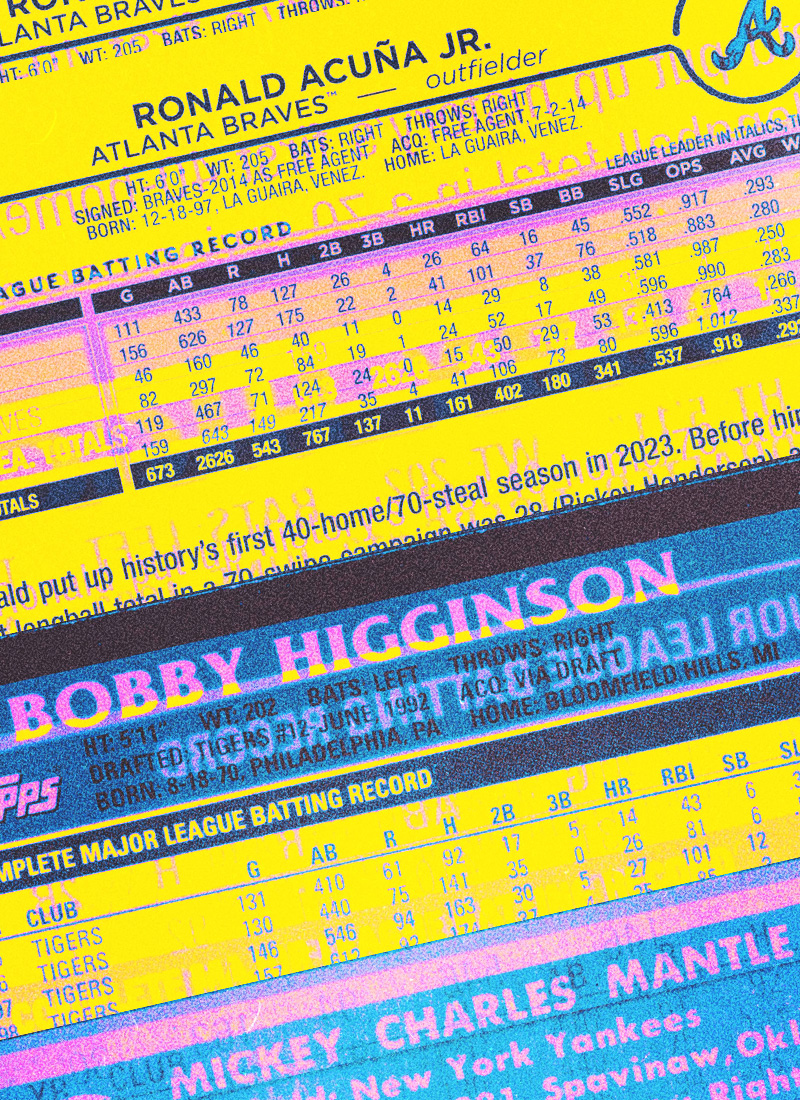
Then, with the inclusion of On-base Plus Slugging (OPS) in 2004, Topps signaled its keen awareness of advanced statistics as a plausible alternative way to tell a player’s story “for our modern times.” By 2014, Topps also included the Wins Above Replacement (WAR) statistic, a controversial figure attempting to indicate a player’s overall strength and impact with a single number. Like Wilson’s updated translation of an old story, these new statistics aim to help us see the story of a player’s life and career with fresh eyes. But comparison is one of the chief pleasures of sports, and consequently, the new statistics raise the same question often put to new translators of old texts: have we strayed too far from the original design?
With the recent release of 2024 Topps Series 1 Baseball, we have an opportunity to review the history of card back design.
A History of Card Backs
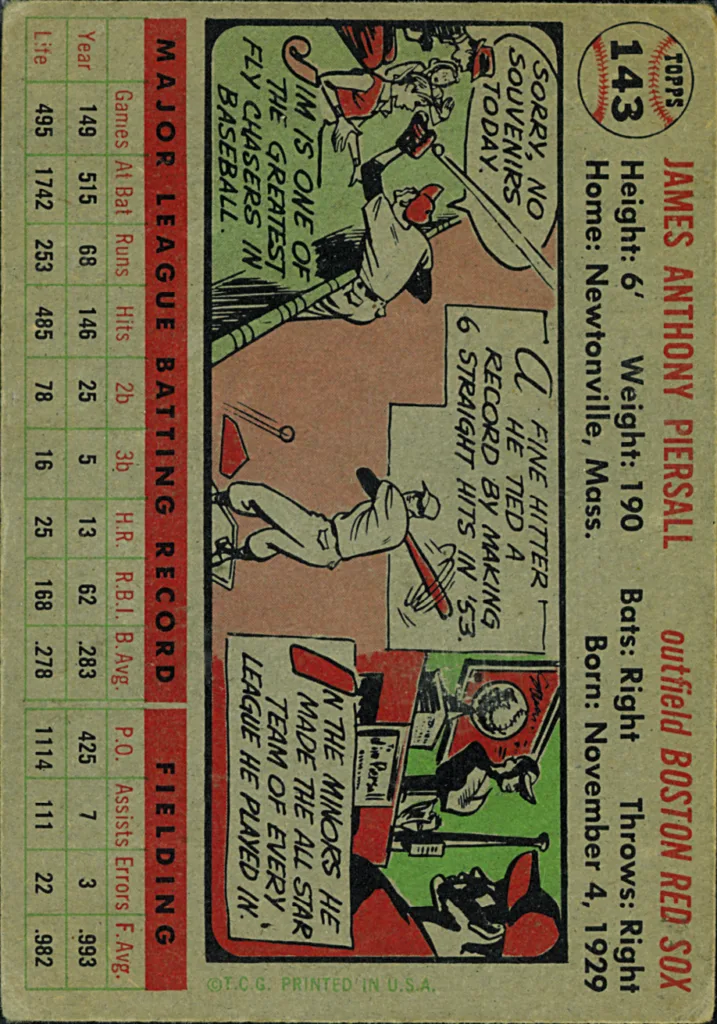
Topps, Bowman, and other card companies have revisited the question of how to tell a player’s story in a 3.5” x. 2.5” space every few years. The back side of the beloved 1956 Topps cards, for instance, featured only two lines of stats—previous year and lifetime—but added an impressive three-panel cartoon sharing trivia about a player’s offseason hobbies, past awards, or how he’d been plagued by injuries. The cartoons were an on-and-off part of the Topps tradition from the early years but have not made an appearance since 2006. Interestingly, the names of the contributing cartoonists are now, for the most part, lost to history.
Beginning in 1993, advances in photography and printing technology allowed Topps to experiment with including photographic images of the players on card-backs, but in Series 1 sets, this innovation has been discarded in the past decade, as statistics have maintained center stage on card-backs. In some cases, full twenty-year careers have been displayed in microscopic print. In other cases (for instance, Jamie Moyer’s 2012 Topps Baseball Update Series card excised states from his first decade) a player’s early year statistics were omitted due to a lack of space.
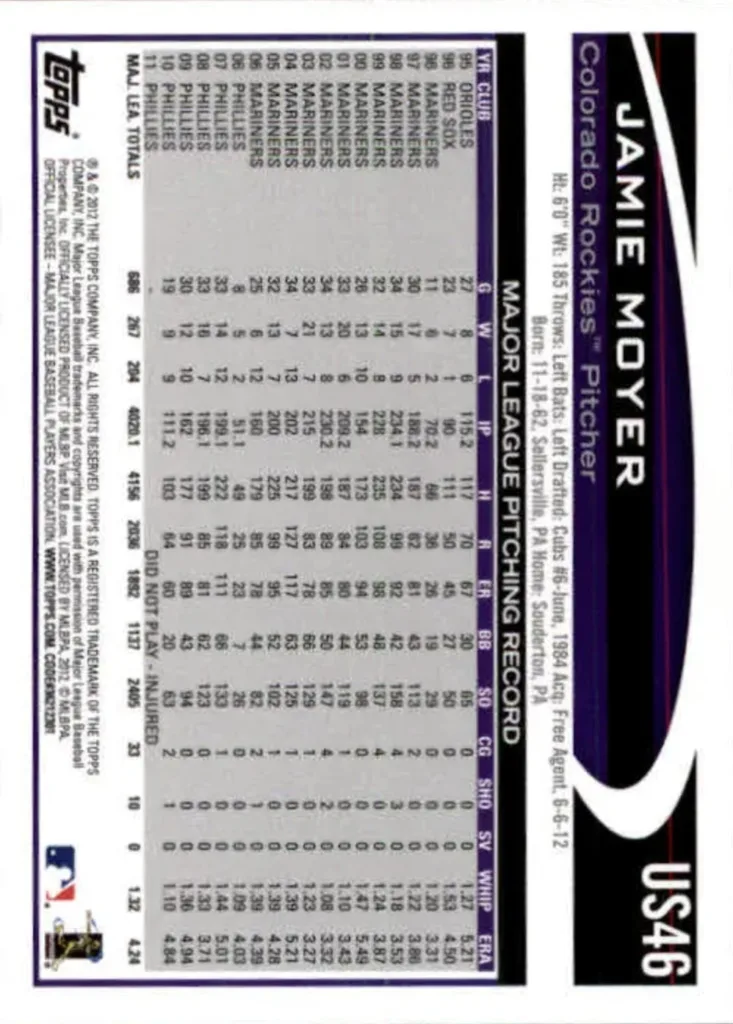
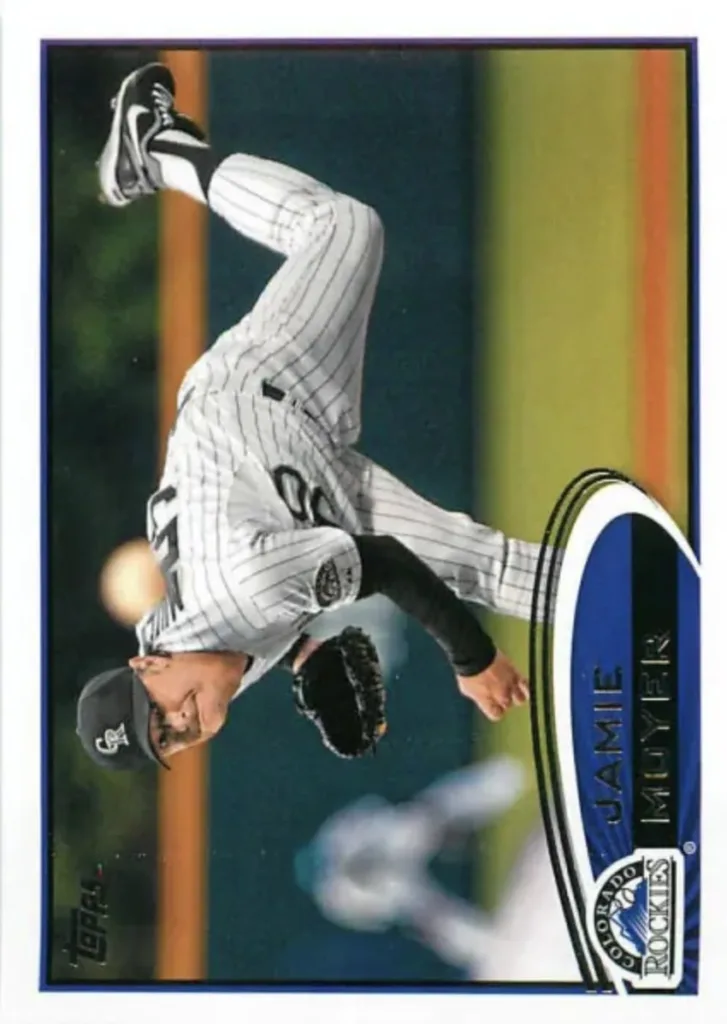
In addition to listing the set number of the card, players’ height, weight, and hometown have been included each year. Batting arm, throwing arm, and birth date also typically appear. The 2014 cards included a “Rookie Fact,” while 2017 cards included players’ Twitter handles. Long-time card collectors have come to expect a certain amount of reconfiguring each year, and inspecting the new layout and design is part of the joy of getting a first glimpse of a new set.
Modern Stories for a Modern Game
As sabermetrics has become integrated into professional analysis of the sport, and fantasy baseball has increased demand for predictive insights into player (and team) performance, researchers have developed new ways of gathering and analyzing data. Pitchers have been subjected to closer scrutiny than ever, with modern metrics designed for measuring Baserunners per Nine Innings Pitched (MB/9), Pitches per Inning Pitched (P/IP), and esoteric measurements with strange names—Bequeathed Runners (BQR), or Skill Interactive Earned Run Average (SIERA). For assessing batters, famed statistician Bill James introduced Runs Created (RC), which is calculated as Total Bases times the sum of Hits plus BB divided by the sum of at-bats plus BB. Got it?!
Whether any of these stats deserve a spot on the standard card-back is a debatable question, but MLB managers and serious students of the game are closely tracking these measures in addition to the standard statistics. For that reason, beginning in 2019, Topps experimented with producing parallel cards featuring modern/advanced statistics. The advanced stat parallel sets have been popular enough to continue running each year since.
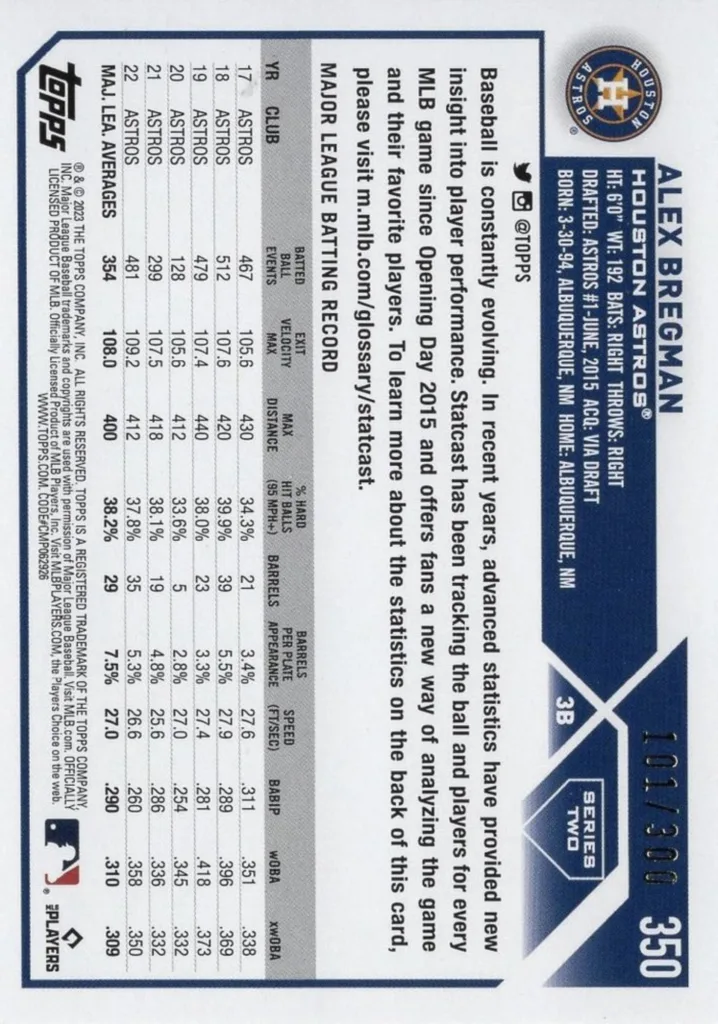
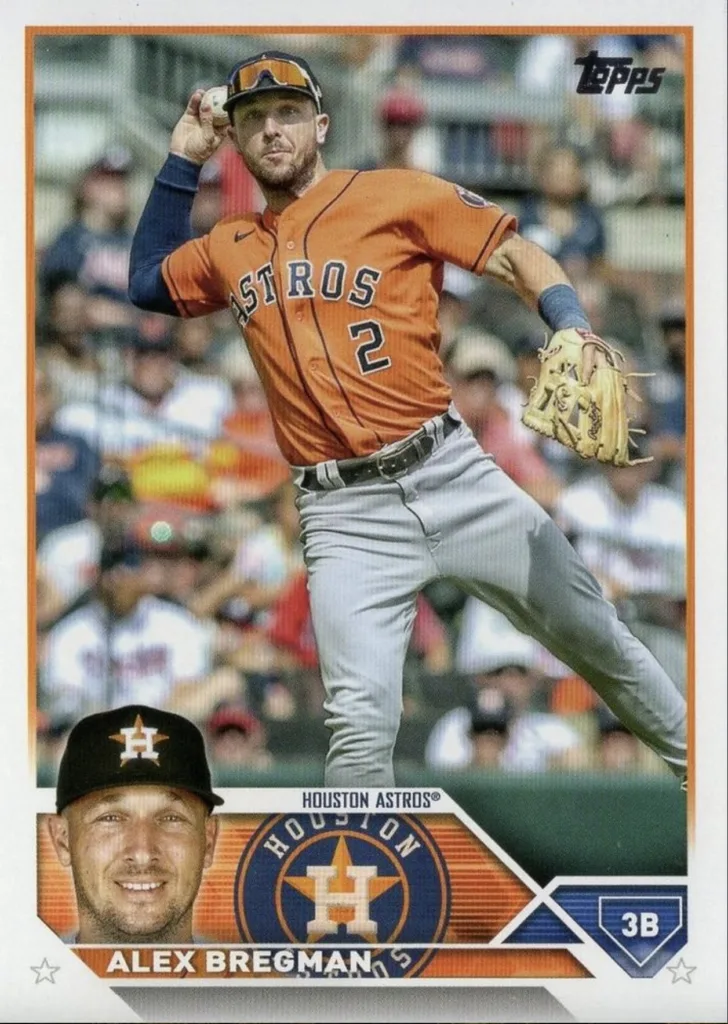
2023 Topps Series 2 Baseball #350 Alex Bregman Parallel Advanced-Stats 101/300
For batters, the traditional statistics included G, AB, R, H, 2B, 3B, HR, RBI, and AVG. Slugging Percentage became standard in 1981. Then, in 2004, OPS was introduced, and a decade later, WAR made an appearance. On the pitching side, WHIP (Walks plus Hits per Innings Pitched) has become a popular modern addition to the standard set.
The questions write themselves here: should some of the newer stats be swapped in to replace the old? Does sharper printing allow smaller fonts, so that nothing needs to be lost even as new columns are added? Or is it finally time to return to cartoons and personal anecdotes? What is the best way to “tell the old story” for a new generation of fans?
Progress and Tradition
Finding an elegant balance between innovation and tradition seems to be a central concern with any evolving artistic form. Whether we investigate architecture, film, literature, or baseball cards, patrons enjoy the familiar aspects of design even as they keep an eye out for new components. Sports fans and collectors who are inclined to techno-optimism—who trust the science and measure twice—are probably inclined to embrace the new stats, whereas romantics and the traditionalists, still sore about the missing stick of gum, may partner in their wariness of innovation.

CHICAGO, IL – AUGUST 6: Exterior, overall, wide angle general view outside Wrigley Field at night during the game between the San Francisco Giants and Chicago Cubs on Thursday, August 6, 2015 in Chicago, Illinois. (Photo by Brad Mangin/MLB Photos via Getty Images)
Like every long-standing American institution, Topps baseball cards have endured by a process of experimentation and refinement, by retaining what is good, what works, and by aiming for better next year. The game itself has followed a similar track, introducing lights for night games (even at Wrigley Field), instant replays, and a pitch timer, even as the pitcher’s mound has remained at 60’6” since 1893.
For some collectors, the back of the card will remain a secondary “B-side” phenomenon, regardless of how the spreadsheet is organized. Still, even in the age of touchscreens and immersive VR headsets, we hope there are still boys and girls who turn their favorite player’s card over and see this obscure numerological storyboard for the first time and who, looking more closely, discover the card-back as another way of understanding the players and the game.
